ADA/BTC (Bull break: up to 20% profit?)ADA/BTC
ADA broke the descending channel to the upside but with not enough strong momentum If we see a minor pullback.
The potential good buy zone is at 460 sats area and targets up to 510 - 570 sats levels.
Applying a tight stop-loss below 445 sats level.
Search in ideas for "ada btc"

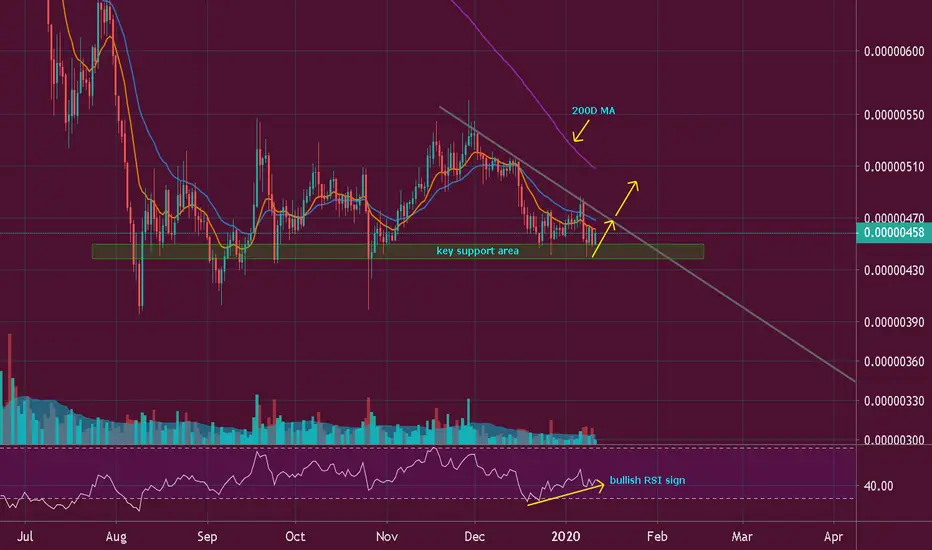
ADA/BTC TA Update (Bullish Attempt again?)ADA/BTC
Bears are starting to show some weakness as the price manages to keep the same Low from the previous support area.
We can also see bullish early signs on the RSI giving us extra confirmation of bear exhaustion.
I'm expecting the ADA to challenge the downward trend-line resistance again and potentially break it for the 3rd attempt.
Target to the upside is the 200 Day MA dynamic resistance area.
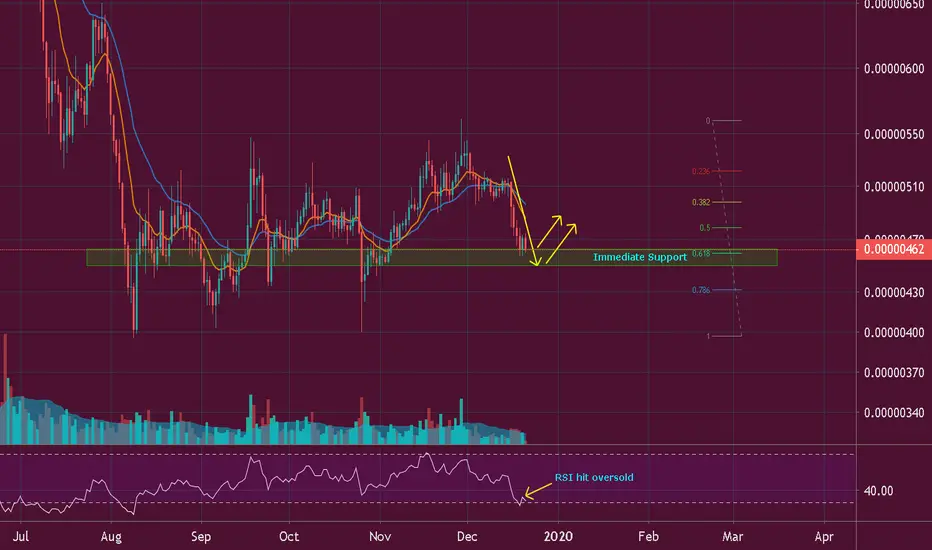
ADA/BTC TA Update (Will bounce at Golden Fib?)ADA/BTC
ADA sank 11% from 513 sats last Dec 16 and price is already trading just above the golden Fib 0.618.
RSI also hit oversold levels which could sparks a potential relief rally to the upside since the drop is sharp.
Otherwise, a daily close below 450 sats will increase bearish momentum to the downside again.
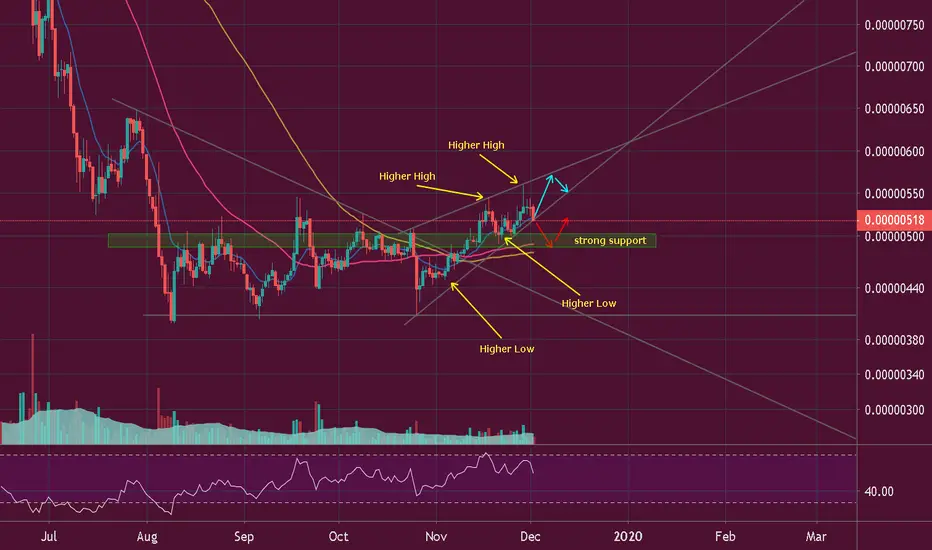
ADA/BTC TA Update (Bearish Pattern?)ADA/BTC
ADA is still in an uptrend movement as long as we can keep this Higher Low series and holding previous support.
Though the technical pattern is a rising channel (bearish) if price keeps respecting this upward support,
the price can continue going up. I have pointed out in the chart where the price can move both directions.
ADA/BTC (Up to 96% Profit Target)ADA/BTC
ADA Broke above down-line resistance and made a Higher Low than a Higher High. Price is trading above both 50 Day MA and 100 Day MA.
To keep the uptrend then intact, we must not close below Higher Low to fight the bears out.
Trade setup
Buy area: 487 Sats - 450 Sats
Sell target: 540 Sats - 880 Sats
Stop loss: 399 Sats
Don't forget to click on the thumbs up button
Follow my channel for future Altcoins TA updates
www.tradingview.com
Join Free Trading Community Chat Group
t.me
Trading is simple, don't over complicate things :)

ADA/BTC | Potential Bounce Coming UpADA/BTC is overdue for a bounce I believe.
We can see some nice bullish divergence on the higher timeframes.
If the resistance around 1370 sats breaks and acts as a support, I think we might see a retrace to the 0.382 - 0.5 fib levels.
Bitcoin might ruin the party if it drops below 5300$ though.


ada/btcADA/BTC already breakup down trend. Price above 20DMA.
Target 1: 1.013 sat base on TD breakout (same 38.2% fib retracement)
Target 2: 1.072 sat base on TD breakout
Target 3: 1.103 sat base on fib retracement 61.8%

ADA/BTC > Short-term targets <ADA/BTC targets for short-term is:
First target: 918
Second target: 1018
Third target: 1062
The break-out of this wedge give us a strong signal for a bullish wave ,,, i'll update soon
-Dont forget to Follow & Like
Thanks.

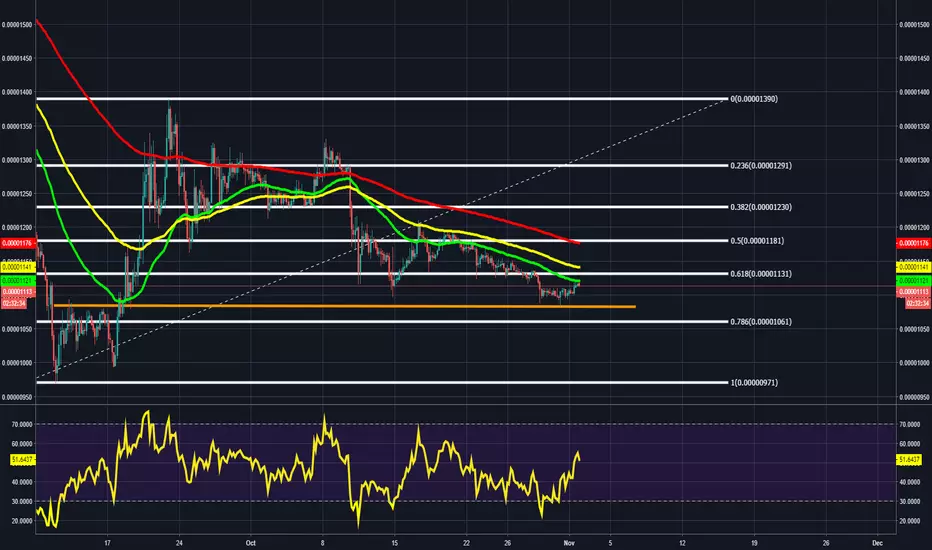
ADA/BTC finding resistance at the 50 EMA on the 4-hour. ADA/BTC is currently finding resistance at the 50 EMA on the 4-hour chart. I'll be watching for a retest of the orange line as support. We've seen the orange line hold as support before, and it acted as a previous resistance zone back in September, so we are seeing prior resistance act as support. If the orange line breaks, it'll most likely retest the .786 fib level around 1060, and if that breaks, we could see it move down to the 1 fib level around 970-980. I suspect it will retest the orange line, as for we are already seeing the 50 EMA on the 4-hour act as resistance and we have more overhead resistance from the .618 fib level around 1130, and we have the 100 EMA on the 4-hour at roughly the same level as the .618 fib level. If we can get above the 50 EMA, we can then seek to attack the 100 EMA and the .618 fib level, and if we can get above and sustain buying above the .618 fib level, we could see ADA make a move toward the 200 EMA on the 4-hour, if not higher to the .5 fib level around 1180.
Area's of interest for entry:
1080-1095 (Orange line support.)
1060 (.786 fib level.)
970-980 (1 fib level.)
--This is not financial advice. Always do your own research and come to your own conclusions before buying/investing, as investing in cryptocurrencies comes with high risk and high amounts of volatility.

ADA/BTC- AUGUST 10 BTC ETFADA/BTC is now in a position to follow closely with BTC on the expectation of SEC approval of the BTC ETF on August 10th. Chart agrees with the idea that on August 10th we will see a positive trend begin.


ADA/BTC (Cardano) Topping W3, W4 pullback then W5 up!ADA/BTC (Cardano) 05/03/18, 1:10 p.m. EST, by Michael Mansfield for CyptoPlayhouse
Hi trader friends! I see that the Cardano (ADA) token is topping in a Wave (V) of a larger Wave 3, in Elliott Wave terms. Since we also see 5 waves up on the 4-hour chart since the April 25th low, the current Wave 3 top should be in! If not today, the remotely possibly tomorrow.
Since ADABTC wave top is likely in place, Cardano should now begin a Wave 4 pullback lasting 5-12 days. This will likely be followed by a Wave 5 up to around 0.000050 area to finish this entire 1-5 bullish wave sequence from the March 18th low of 0.00001666, which happened to be a bullish Hammer candle formation. Not a bad move, Cardano!
After this entire larger 1-5 Elliott Wave up pattern is completed, we would likely see a larger degree ABC correction to this upcoming Wave 4 retracement area once again. Then, repeat 1-5 Waves up on a larger degree, IF this analysis is correct. This is a relatively high confidence forecast.
IDEAS:
You might look to short for 3-5 price bars down, then wait for the low to be confirmed on whatever time-frame you trade with hopefully a clean buy setup reversal bar up to reverse to long buy position around the suggested Wave 4 low target area shown on the chart.
RATIONALE:
Waning momentum on TSI and MASIC.
Bearish divergence & MASIC turned down!
Five waves up on this topping Wave (V) of larger Wave 3, likely at or near the Mansfield modified Andrews 0.618 line.
Volume accelerated on Wave (iii) of 3, as it should, with Wave (v) of 3 showing less volume, as would be expected, which provides excellent conditions for text book Wave 4 pullback/retracement.
Bearish reversal candlestick price bar is forming.
GANN FAN line is also providing resistance in this area
---------------
The forthcoming retracement should find its way to the prior Wave (iv) area,
which, is where the Wolf Wave support line is.
TRADER TIP: A bullish Wolf Wave support price target line is
drawn from the Wave (i) high to the Wave (iv) low (opposite for a bearish Wolf Wave resistance price target line). In either case, these are supposedly minimum price expectations. Test this out for yourself. Use prudently along with other supporting/confirming techniques.
CYCLES: As with a lot of the newer tokens, there is not much data from which to extract cycles from. These two cycles are the best current estimate, but not to trade off of yet.
DISCLOSURE:
This analysis is meant for educational purposes only. You trade at your own risk!
Michael Mansfield CIO

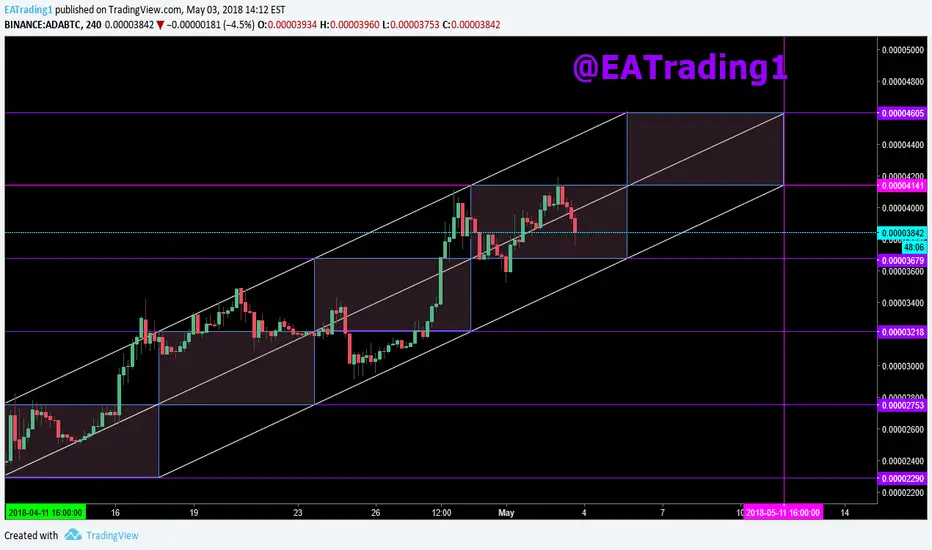
ADA/BTC *BUY AND SELL TARGETS*ADA/BTC
Buy zone: 3700 - 3870
Sell Targets:
First target: 4100
Second target: 4600
*Stop-Loss: Close 4H candle under 3685
*Dont forget to follow me to check ur currencies everytime*

ADA/BTC Possible upcoming playADA/BTC has been bleeding for quite some time now with little to no retraces and bounces.
We are reaching a an area at which a higher bounce or a full market reset is more likely. Would need to see a confirmation of support in the green zone to determine the entry better.
So far Range of 1500-1000 seem most likely for an entry point, going below 1,000 can push it to a an extremely low point at which it will have to bounce really hard from to push it back bullish.
I expect to see some kinda reversal happening first week of April, would like to see at least a couple of days in the support area, with increased volume to push us back out of it.

ADA/BTC A move through the cloudADA/BTC currently in the 12H cloud trying to move forward. Upon reaching the other edge of the cloud I expect a retrace to either a fib or a trend line. Most of the higher time frames are topped off and need a pullback.
We'll see if the lower time frames have momentum left to push the other edge. This could lead for a nice short play on futures for a small % gain and an entry for a possible new long position.

ADA/BTC Buy signal 20180412ADA/BTC: Potential net profit = 40% if bought at buy signal generated and sold at highest price today
Stats:
*Script: Bottom Finder v8
* Period: 1hr / 15min
* RSI at buy: 45 /45
* RSI at sell: 83
* Last buy signal generated: 7 days ago (05/04) / 1 day ago (11/04)
* Value at signal: 0.000020 BTC / 0.0000224 BTC
* Highest value today: 0.000028 BTC / 0.000028 BTC
* Potential Net Profit: 40%

ADA/BTC potential setup for a quick tradeADA/BTC is currently at the support line of the falling wedge.
If it breaks out of the resistance of the falling wedge at 0.00003270, it will be a buy signal.
This is a quick trade (1h chart), and stop loss at 0.00003195 (orange dashed line) is strongly recommended.
First target: 0.00003519 (local top)


ADA/BTC the next move up is a massive..ADA/BTC has a massive move coming. if it holds 1000 sats then 1500-1820 sats is in play! I don't expect this to happen as quicking as the move from 500 sats to 1200 but it will happen soon. Probably by late december or early January. God Speed and NFA
